


The past few weeks has seen an unstoppable epidemic … of statistics. The flood threatens to overwhelm us all, but what do all these numbers mean? Here are eight statistics you may see, with some warnings about how much we might trust them.
1 The number of new cases each day This can be a very poor reflection of the number of people who have actually been infected, as it depends crucially on the testing regime – up to 9 April, 1.3 million tests had been carried out in Germany, versus 317,000 in the UK.
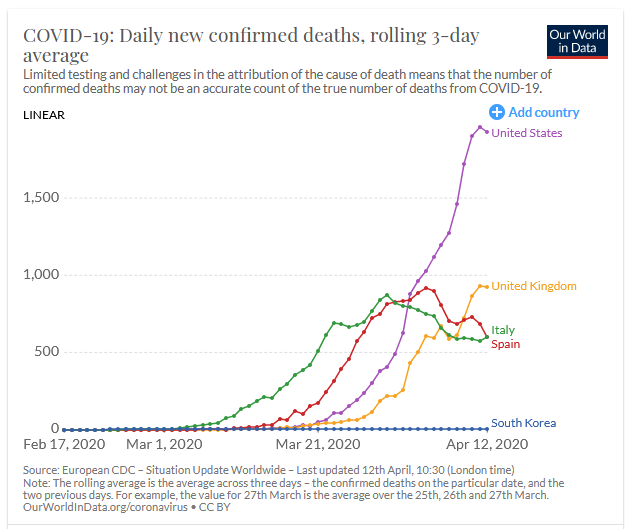
2 The number of new deaths each day The range of sources is bewildering. The daily announcements should be treated with caution as they only include deaths in hospital of those who have tested positive for coronavirus, and there is generally a delay in reporting deaths of a few days or even longer. For example, while on 27 March the government announced that 926 Covid-19 deaths had so far taken place in English hospitals, NHS England now reports that the true figure was 1,649. T the gold standardis the number of death certificates collated by the Office for National Statistics: it report at least 1,568 mentions of Covid-19 for all deaths up to 27 March, but this will increase as registrations come in.
3 The total number of deaths Graphs of accumulating deaths are shown at the daily government press conference, but they are a hopeless tool for spotting trends: we need daily counts to see whether we have reached a plateau (which will not be a “peak”). But the daily counts are volatile, and so need some smoothing to bring out the underlying trends: World in Data uses a three-day moving average.
4 Numbers recorded on a logarithmic scale This will have a vertical axis labelled 1, 10, 100, 1,000. These are useful for comparing trends, but useless for getting an impression of the magnitude of the problem.
5 Predictions from models Computer models come in two types. The first tries to model the epidemic itself, by making simplified assumptions about the mechanismby which a virus spreads through a community. Key quantities, such as how many people an average case will infect, are highly uncertain at the start of an epidemic but are refined as more data is gathered. Such models have formed the basis for predicting the consequences of policy decisions in the UK.
6 “Excess deaths” The number of extra deaths that will be recorded in this period, due either to Covid-19 or the lockdown, is hotly contested. Lives will be lost because of the illness, reduced medical care for everyone, domestic violence and the effects of unemployment and poverty; and lives will be saved through fewer accidents and, particularly, improved air quality. A (disputed) fraction of those dying would have died anyway in the coming year, a phenomenon known as mortality displacement or even “harvesting”. But the overall effect is hard to predict, and confident claims should be treated with scepticism.
7 The lethal risks of being infected These vary dramatically with age and frailty, just as “normal” risks do. In fact the current estimates for the general public (rather than healthcare workers) seem remarkably similar to the risks we face anyway each year – but all packed into a few weeks.
8 The “accuracy” of an antibody test Even apparently accurate antibody tests can lead to many false assurances of immunity. But a less accurate test may be fine if we are testing a representative sample to estimate the proportion of a population who have immunity.
Finally, it’s tempting to link a country’s statistics to the measures they have taken to control the virus: for example, has Sweden’s more relaxed policy been as effective as lockdown? But countries differ in so many ways: basic demographics, compliance and social networks, testing capacity and policy, health service characteristics and so on. Former prime minister Carl Bildt has joked that Swedes “have a genetic disposition to social distancing anyway”.
_________________
Sylvia Richardson, director, MRC Biostatistics Unit, president elect of the Royal Statistical Society; David Spiegelhalter, chairman, Winton Centre for Risk and Evidence Communication
Credit: The Guardian