













A modest proposal
Economists have several ways of telling us whether we are prosperous. They can measure gross domestic product, average income, purchasing power, inflation and the price of a basket containing everything from breakfast cereal to a new refrigerator.
The results are extremely precise, frequently revised and not always recognizable to anyone who actually lives in the place being measured.
The Charlie Larga Local Living Index begins with a simpler question: Can the people who keep a community functioning afford to live reasonably well in it?
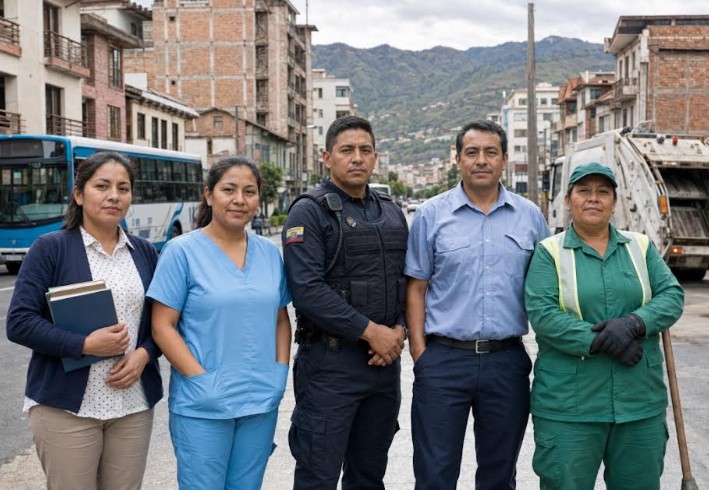 The index would examine five occupations: teachers, nurses, police officers, bus drivers and sanitation workers. These people can be found in almost any established community on the planet. They cannot generally work from a beach in Ecuador while collecting a salary from California. They must live close enough to turn up for work, and the community depends upon them doing so.
They also have jobs that are normally full-time, regularly paid and capable of becoming lifelong careers. We are not comparing teenagers selling ice cream during the summer, freelance consultants enjoying an unusually good month, or expatriates arriving with pensions earned somewhere more expensive.
Teachers and nurses represent qualified professional employment. Police officers represent government service and public authority. Bus drivers represent skilled work that normally does not require a university degree. Sanitation workers add essential manual labour. Between them, they provide a reasonably broad cross-section of the people who make ordinary urban life possible.
Globally, these occupations probably account for around 5 percent of all workers, or approximately one worker in twenty. That is not the entire workforce, but it is a large and strategically selected sample and, importantly, it exists in every urban community. If nurses, teachers and sanitation workers cannot afford decent housing in the place where they work, something important is happening, however impressive the national GDP may look, and if a community cannot afford these workers, then you probably won’t want to live there anyway unless you are an off-grid enthusiast.
Choosing the occupations for the CL index was not as easy as it might appear.
Postal workers initially looked promising. They have recognizable jobs, regular salaries and long careers. Unfortunately, they totally fail the Ecuador test, because Ecuador does not have local mailmen delivering letters to every house.
Firefighters were another possibility, but many communities depend partly or entirely upon volunteers. Construction workers are found everywhere, but their employment may be temporary, seasonal or paid by the day. Agricultural workers are universal, but their work and compensation vary too greatly. Some receive salaries, some are paid by the harvest, and others work their own land.
Retail and restaurant employees are numerous, but many work part-time or move in and out of the occupation. Bank tellers once looked like permanent fixtures of modern life, but cash machines and banking apps are making them increasingly scarce. Office clerks are difficult to define consistently, and the term “civil servant” covers everyone from the person stamping a form to the person running the ministry.
Doctors were excluded because their earnings, status and methods of payment differ too greatly. A doctor might be a modestly paid government employee in one country and a highly paid private specialist in another. Nurses provide a more consistent international comparison.
Sanitation workers therefore became the fifth group. Every community produces garbage, although some are considerably more organized about removing it than others.
The Charlie Larga Index would not simply convert salaries into US dollars. That would tell us that a teacher in Ecuador earns less than a teacher in Canada, which we already knew and which tells us very little.
Instead, the index would begin with the median take-home pay for an established full-time worker in each occupation. It would then calculate how much of a standard local monthly budget that salary could purchase.
The budget might include:
- Rent for a modest but decent one-bedroom apartment
- Basic utilities and internet
- Nutritious food prepared mostly at home
- Local transportation to work and shopping or markets.
- Healthcare expenses and insurance contributions
- Clothing and household necessities
- A small emergency fund
- A modest allowance for recreation
The resulting figure could be expressed very simply. A score of 100 would mean that one monthly salary exactly covers the standard basket. A score of 125 would mean that the worker earns 25 percent more than the cost of the basket. A score of 80 would mean that the worker is short by 20 percent and must share housing, work overtime, rely on family members or do without something.
A second version could calculate whether two workers can support two adults and two children. That would prevent the index from assuming that every bus driver lives alone in a one-bedroom apartment and never has to buy a school uniform.
Pensions, paid holidays, job security, subsidized healthcare and annual bonuses would have to be shown separately. Ecuador’s décimo tercero and décimo cuarto payments, for example, cannot simply disappear from the calculation. Nor should an American employer’s health insurance, a British public employee’s pension or a Spanish worker’s paid vacation be treated as worthless merely because it is not included in the weekly pay packet.
The United States would probably produce the highest salaries and some of the most uneven results. For example an ICU nurse might earn what appears to be an excellent income, yet face expensive housing, car ownership, insurance deductibles and childcare, and even have to pay to park at their place of work. A schoolteacher in rural Ohio and a teacher in San Francisco may technically have the same occupation while living in different economic universes. The index would therefore need to compare cities rather than entire countries.
Canada would present a similar problem. Public services and healthcare coverage may reduce some household expenses, but housing costs in Toronto or Vancouver can consume a startling proportion of a regular salary. A Canadian nurse may earn far more than an Ecuadorian nurse while having less money left after paying rent.
Britain has nationally recognizable salary structures for many public employees, but living costs vary sharply. A police officer or teacher in northern England may be reasonably comfortable on a salary that would be severely strained in London by the cost of housing and travel to work. The British results would also expose the difference between having a secure pension and having enough money available today.
Spain generally has lower salaries than Britain, Canada or the United States, but universal healthcare, cheap public transportation and, outside the most expensive cities, lower housing costs may compensate for part of the difference. A Spanish bus driver earning a lot less euros might enjoy a standard of living closer to that of a much better-paid North American driver than currency conversion suggests.
Ecuador would almost certainly come last in nominal salaries, but that need not mean last in every measure of daily life. In Cuenca, a worker may use a 30-cent bus or the Tranvía rather than maintaining a car. Basic food, healthcare and some rents remain comparatively inexpensive. On the other hand, imported goods like cell phones are costly, access to credit is limited or very expensive if you want to make purchases by instalment, and a modest salary leaves little room for emergencies or retirement savings.
The interesting comparison would not be who earns the most. We know the answer to that before doing the arithmetic. The interesting question is who has the greatest proportion of income remaining after securing a decent ordinary life.
The US Social Security cost-of-living adjustment is based on the Consumer Price Index for Urban Wage Earners and Clerical Workers, known as the CPI-W. It measures how the prices of a basket of goods and services change over time. Social Security compares the average CPI-W during the third quarter with the corresponding figure used for the previous adjustment. For 2026, that produced a COLA of 2.8 percent.
The two indexes would probably move in the same general direction, but not necessarily at the same speed. If the CPI-W rose by 4 percent while the salaries of teachers, nurses, police officers, bus drivers and sanitation workers rose by only 2 percent, the Larga Index would fall because those workers had lost purchasing power. If their salaries rose by 5 percent while their local living costs rose by 3 percent, the Larga Index would improve.
It might also produce a less flattering result than the CPI-W because housing would have a particularly strong influence. A national consumer-price index can report moderate inflation even while rents in Toronto, London or an American coastal city are rising much faster. Conversely, an Ecuadorian city with low inflation and stable rents might score comparatively well despite very low salaries in dollar terms. The CPI-W tells us how prices have changed; the Larga Index would tell us whether essential workers are swimming or sinking in the race for survival against the tide of rising prices.
That COLA calculation attempts to preserve purchasing power. It does not ask whether the original Social Security payment was adequate, whether rents in Florida rose faster than rents in Iowa, or whether retired people buy the same things as working clerical employees. (Hint: they don’t.)
The British triple lock does something different again. The State Pension normally increases by whichever is highest: consumer-price inflation, average earnings growth or 2.5 percent. It therefore provides some protection not only against rising prices but also against retirees falling steadily behind working people.
The Charlie Larga Index would borrow something from both systems. Like a consumer-price index, it would track the changing cost of essential goods and services. Like the earnings element of the triple lock, it would also track whether the salaries of essential workers were keeping up with the wider community.
But its principal purpose would be different. The CPI asks, “How much did prices rise last year?” The triple lock asks, “How much should pensions rise?” The Larga Index would ask, “Does a normal full-time career still provide a normal life?”
The index could begin with five occupations in five cities, perhaps Cuenca, Jacksonville, Toronto, Leeds and Valencia. Local salary scales would be collected, taxes and mandatory deductions removed, and the same broad standard of decent living applied to each city. Over time, other cities and countries could be added. Separate scores could be published for each occupation, along with one combined figure. The annual change would reveal whether essential workers were gaining or losing ground.
There would be arguments about what constitutes decent housing, whether a car is essential, how much recreation should be allowed and whether a nurse deserves more than a bus driver. This would not invalidate the index. Official consumer-price baskets are also constructed from judgments about what people buy and how much importance each item should receive.
No single number can describe everyone’s standard of living. The Larga Index would not replace the Consumer Price Index, GDP or purchasing-power calculations. It would provide a different window into the same society.
A thriving community should not merely contain expensive apartments, fashionable restaurants and impressive statistics. Its teachers should be able to teach there, its nurses should be able to nurse there, its police officers should be able to police there, its drivers should be able to drive there and the people paid to collect the garbage should not have to live among it.
That may not be sophisticated economics, but it seems like a good place to start.



Hogar Esperanza News


Fund Grace News

The Cuenca Dispatch

Week of September 06

U.S. sinkings of Ecuadorian fishing vessels trigger court scrutiny after 28 crew members are released.

Cuenca targets a November launch for its first new international link to Chiclayo.

Exports hit a quarterly record, but Ecuador’s import bill is rising even faster.
Fabianos Pizzeria News